- US major indices close higher on the week; S&P 500 now 2.4 percent from record
- Russell 2000 under pressure, demonstrating trade war could be of receding interest
- Investors rotate into mega caps
- Oil back above $70
- Dollar under pressure
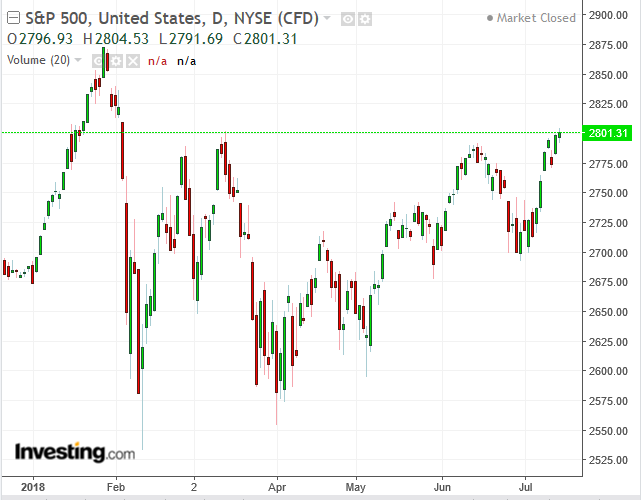
Markets appear to be pricing in another quarter of double-digit economic growth, after the most significant corporate tax cuts in history. All of which, on Friday spurred traders to bid up US equities for the second week in a row. The Dow finished the day up 0.38%, the S&P 500 was up 0.11% while the NASDAQ Composite closed just a hair higher, finishing up 0.03%.
Positive economic data is being buttressed by increasing hopes of a buoyant earnings season, with early reports on Friday from JPMorgan Chase (NYSE:JPM) and Citigroup (NYSE:C) showing handsome beats for both major banks. As we head toward the start of next week's trading, most stocks are just a couple of percent from their all-time highs.
Trade Fears Waning?

The S&P 500's climb on Friday was led by defensive Consumer Staples (+0.65 percent), demonstrating that investors are still mindful of the global trade dispute. However, Consumer Staples was followed closely by growth sector Energy (+0.53 percent) and more importantly Industrials (+0.52 percent), a sign that demand is picking up for the most beleaguered sector in a world beset by a trade war.
The leading benchmark rallied 2.6 percent on a weekly basis, advancing for a second week and posting a higher peak—extending the uptrend since the February low, to reach the highest close since February 2, closing just 2.6 percent below its January 29, all-time high.
The Dow Jones Industrial Average outperformed the S&P 500 on Friday, as ebbing trade concerns rendered the export-reliant mega cap index under-priced. In this sense it mirrored SPX Industrials. The Dow added 2.4 percent for the week, leaving it 6.4 percent from its record high of January 26.
The NASDAQ Composite posted a dual record on Friday, both on a closing and high-price basis. Its increased 0.41 percent on the week. The price on Friday formed a Doji Japanese candlestick, which could signal that the rally is losing steam. The gap between Thursday's and Friday's price action also sets this up for an Evening Doji Star, a pattern that demonstrates bears are taking over.
That will be more likely if Monday's price action gaps down; as well, a closing deeply into Thursday's candle's real body would be another sign (price action between open and close, excluding the shadows, the intraday high and low) it it's traded with heavy volume.
The Russell 2000 bucked the upward trend. It fell 0.2% on Friday. The small cap index also retreated 0.32 percent on a weekly basis, but still managed, on Tuesday, to post an intraday new all-time high, before it closed with a loss.Technically, the weekly price action formed a Doji, confirming the resistance of a preceding Doji three weeks earlier, in mid-June, which was the centerpiece of a bearish Evening Star pattern.
While global trade remains in the headlines, with the potential for another round of tariffs to the tune of $200 billion of Chinese goods still front-and-center, pressure on small caps is an encouraging sign. The only reason the Russell index has been outperforming is the small size of its listed companies, which allows them continued growth from domestic sales alone, providing immunity from a trade war which affects only companies relying on exports for growth.
Should the tide turn and shares of local firms begin to significantly lose steam, it would be a market indicator that traders are over the trade war. Were that to be the case, the Dow might stand to be the biggest winner, since it would be considered underpriced in the post-trade-war market narrative, after having been sold when trade dominated market psychology.
However, even if the new batch of tariffs directed against China were to stay on the docket, it will take time for them to trigger. Public comments and hearings on the matter are scheduled for August 20-23, followed by a decision due sometime in September. That leaves investors precious time in which to focus on market nuts and bolts.
With underlying economic fundamentals still positive and earnings expected to remain robust, a trade dispute is likely to recede into the background. From the current vantage point its impact is debatable and any assumed metrics about its possible effect primarily educated guesswork, at best.
That doesn't mean an escalation of diplomatic tensions won't increase volatility. To be honest, we'd be surprised if they didn't. Long-term investors will need to keep their eyes on the prize—buying and holding, since we remain convinced prices will rise. At the same time, short-term traders will have a target-rich environment for quick trades, preferably within the uptrend, on the dips.
Week Ahead
All times listed are EDT
Sunday
22:00: China – GDP (Q2): forecast to grow by 6.7 percent YoY from 6.8 percent and 1.6 percent from 1.4 percent QoQ.
This particular read will carry additional weight during a trade war between the world's two largest economies. We've been saying that the US has been "winning" the trade disagreement, in the sense that its assets have been rising, while China's have been falling. This includes its major equity benchmark, the Shanghai Composite, entering a bear market and its currency, the yuan, reaching an 11-month low. Government economists might therefore be suspected of producing a positive surprise, since China's data hasn't always been considered truly representative.

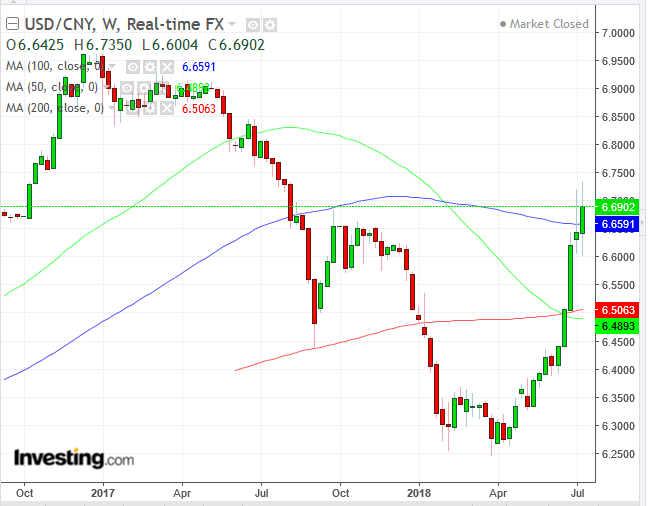
The USD/CNY pair did not only overcome its preceding, September peak but closed above it, in a sign of bullish determination. As it did so, it also closed above the 100 WMA, after crossing above both the 100 and 200 WMA three weeks earlier. Note, however, the Death Cross a couple of weeks earlier, when the 50 WMA crossed below the 200 WMA.
Monday
8:30: US – Retail Sales (June), Empire State Manufacturing Index (July): sales expected to rise 0.6 percent Mom from 0.8 percent and Empire State Index to fall to 22.75 from 25.

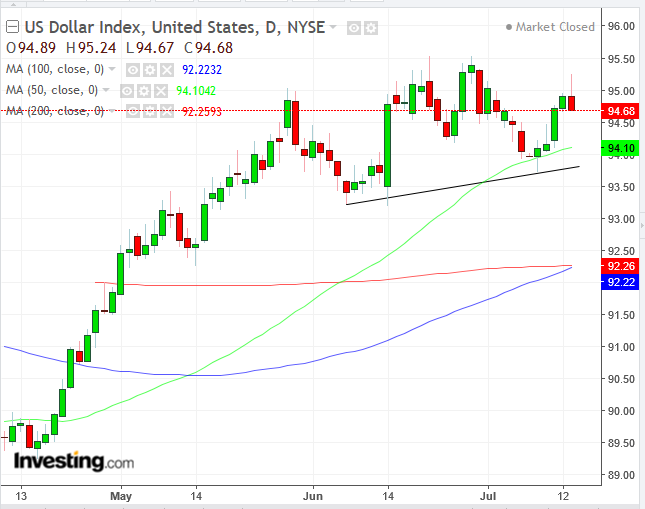
The Dollar Index fell on Friday, down 0.22%, forming a shooting star. However, it advanced 0.7% for the week, driven by trade war worries and comments by US President Donald Trump against other countries during his Europe trip.
Technically, the dollar has been consolidating since May 30. Should the bearish implication of the Friday close push prices below 94.00, they may next cross below the neckline of an H&S top, "guarded" by the 50 DMA (green). Meanwhile, the 100 DMA (blue) is attempting a bullish crossover of the 200 DMA (red). A failure would add to the bearish outlook of technically oriented traders.
Tuesday
4:40: UK – Employment Data: May unemployment rate to rise to 4.3% from 4.2%, June claimant count to be 11K from -7.7K, and May average earnings to increase 2.7% from 2.5% (including bonus).
Wednesday
4:30: UK – CPI (June): YoY inflation to rise 2.5% YoY from 2.4%, and core CPI to be 2.3% from 2.1% YoY. MoM CPI to be 0.4%, in line with May.
5:00: Eurozone – CPI (June): final YoY figure to be 2% from 1.9%, and 0.1% MoM from 0.5%.
8:30: US – Housing Starts and Building Permits (June): starts to be down 4% MoM from a 5% rise and permits to be up 0.7% MoM from a 4.6% fall.
10:30: US – EIA Inventories (w/e 13 July): stockpiles forecast to fall by 1.9 million barrels, from a 12.6 million decrease a week earlier.

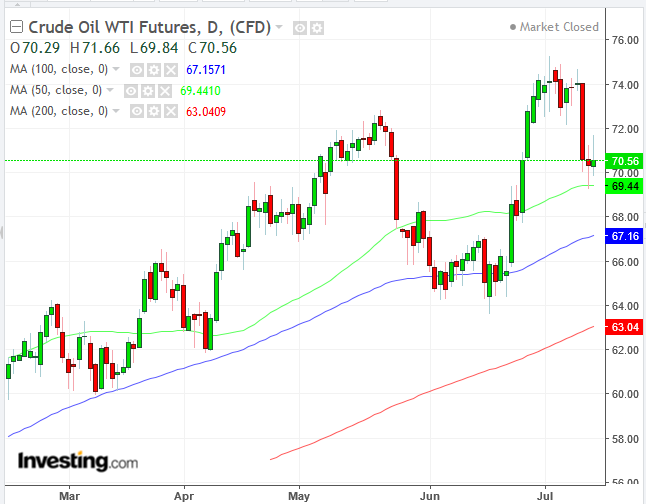
The price of oil managed to remain above the $70 key level, despite the sharpest one-day decline in nearly 13 months, after Libya renewed production amid an outlook for waning demand. The narrative overshadows the most significant fall in US crude oil inventories in almost two years.
As well, Wednesday's selloff was followed by two consecutive Doji on Thursday and Friday, demonstrating that the commodity's move has lost steam. Finally, the price found support above the 50 DMA (green) – all signs that prices may be rebounding, as the sharpest drawdown in almost two years gets priced-in.
19:50: Japan – Trade Balance (June): deficit expected to be Y235 billion, from Y578 billion a month earlier.
21:30: Australia – Employment Data (June): 18,000 jobs expected to have been created, from 12,000 a month earlier, while the unemployment rate rises to 5.5% from 5.4%.
Thursday
4:30: UK – Retail Sales (June): forecast to rise 2.4% YoY from 3.9% and 0.4% from 1.3% MoM. Markets to watch: GBP crosses
8:30: US – Initial Jobless Claims (w/e 14 July), Philadelphia Fed Manufacturing Index (July): claims to rise to 217K from 214K, while the Philadelphia Fed Index rises to 21.5 from 19.9.
19:30: Japan – CPI (June): inflation expected to be 0.9% YoY from 0.7% and 0.1% MoM, in line with May. Core CPI to be 0.7% YoY.
Friday
8:30: Canada – CPI (June): forecast to be 2.5% YoY from 2.2%, and 0.3% MoM from 0.1%. Core CPI to be 1.5% from 1.3% YoY.
